CAC payback period: formula, 2026 benchmarks, and how to shorten it
CAC payback period is the number of months it takes to recover the gross-margin-adjusted cost of acquiring a customer. You calculate it as CAC divided by monthly revenue per account times gross margin. As of 2026 the median B2B SaaS company recovers its CAC in roughly 18 months, but a healthy target is under 12, and the right number depends on your deal size.
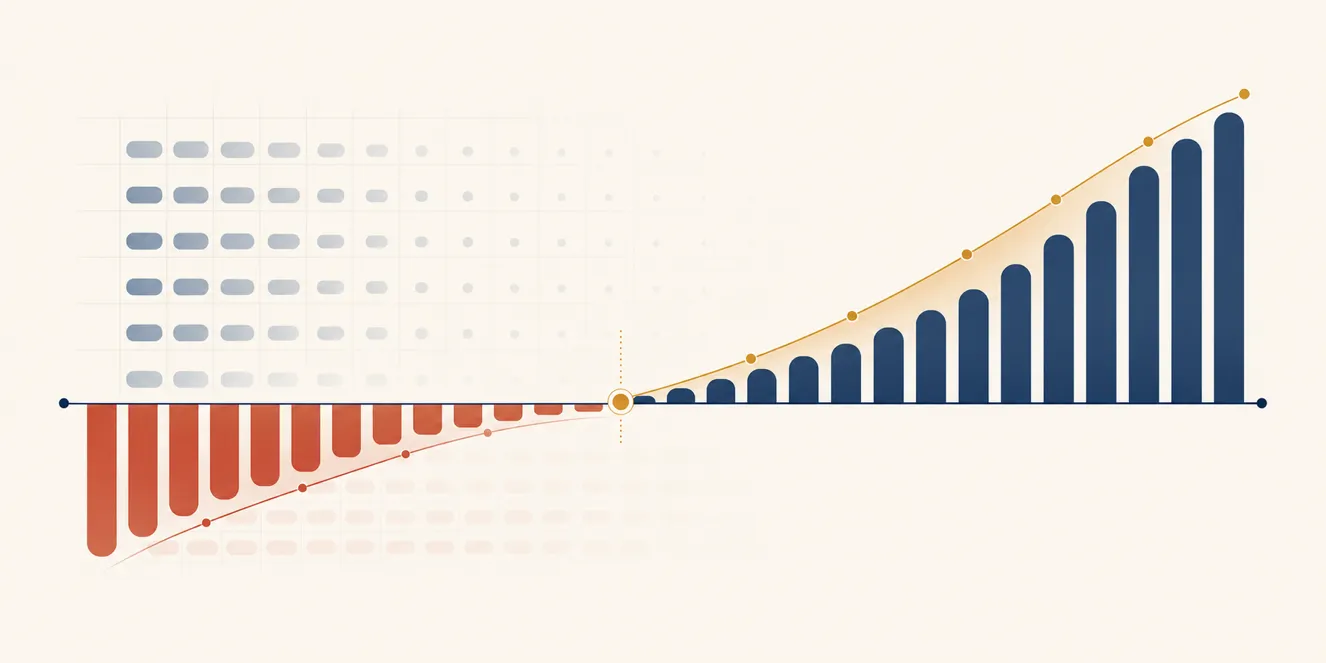
Here is the part most write-ups bury. Because you pay CAC upfront and earn it back slowly, payback (not the LTV:CAC ratio) is the cash-flow constraint that decides how fast you can grow before you run out of money.
What CAC payback period actually measures
CAC payback period is the time it takes a new customer to repay what you spent to win them, measured against the gross-margin-adjusted revenue they generate. It is a months figure, not a ratio, because the question it answers is about timing: how long until this customer is cash-flow neutral?
That timing is the whole point. You spend CAC in month zero, all of it, in one lump. The customer pays you back in thin monthly slices.
If those slices are too thin or the lump is too big, you bleed cash on every new customer for a year or more before they break even. Grow fast enough and you can run dry even with great long-term unit economics.
A short payback means each customer self-funds the next one quickly. A long payback means you need a bigger balance sheet, or more dilution, to grow at the same rate.
The CAC payback period formula
The CAC payback formula, done correctly, is gross-margin-adjusted:
CAC payback (months) = CAC / (monthly ARPU per customer times gross margin %)
The denominator is your contribution margin per month. That is the dollars actually left over each month to repay acquisition cost after you cover the cost of serving that customer. Revenue alone is not what pays back CAC.
Work a real example. Say your fully loaded CAC is $12,000, your monthly ARPU is $1,000, and your gross margin is 80 percent.
$12,000 / ($1,000 times 0.80) = $12,000 / $800 = 15 months.
That customer takes 15 months to pay you back. Not 12.
Here is the trap. Skip the gross-margin step and you get $12,000 / $1,000 = 12 months, which looks 20 percent better than reality. At 80 percent margin the unadjusted number always flatters you by exactly that gap, and the lower your margin, the worse the lie.
Every serious benchmark (Benchmarkit, Bessemer, Stripe) margin-adjusts. So should you. If you want the contribution-margin number without doing it by hand, the CAC payback calculator and the gross margin calculator handle it.
How to calculate CAC correctly
CAC is fully loaded sales and marketing spend in a period divided by new customers acquired in that period. Fully loaded means everything, not just ad spend.
Include:
- Salaries and commissions for sales and marketing staff
- Paid media and ad spend
- Marketing and sales tooling (CRM, attribution, automation)
- Agency fees, content, events, and SDR costs
If $300,000 of total S&M spend won you 25 customers last quarter, your CAC is $12,000. Leave out salaries or commissions and you understate CAC, which understates payback, which is how teams convince themselves a broken channel is working.
Blended vs new-customer vs cohort payback
Use new-customer or cohort payback, not blended. Blended payback divides total S&M by all revenue, including expansion from existing accounts you are not paying to acquire, so it systematically understates the cost of new growth.
The cleaner versions:
- Account-level: CAC / (MRR per account times gross margin %)
- Cohort or portfolio: S&M spend / (new MRR added times gross margin %)
The cohort version is the one to track over time. Group customers by the quarter they signed and watch each cohort pay back. If recent cohorts take longer than older ones, your acquisition is getting less efficient even when the blended number looks flat.
CAC payback benchmarks for 2026
The latest Benchmarkit data puts the median B2B SaaS company at about 18 months to recover CAC, up from roughly 14 the prior year. A blanket number is close to useless, though, because payback scales with deal size: small deals pay back fast, enterprise deals slowly.
Here is the picture by ACV band:
| Segment | ACV | Typical CAC payback |
|---|---|---|
| Very small deals | At or below $5K | ~9 months |
| SMB | Below $15K | 8-12 months (Optifai) |
| Mid-market | $15K-$100K | 14-18 months (Optifai) |
| Enterprise | Above $100K | 18-24 months; ~24 median (Benchmarkit/Optifai) |
| Top performers | Any | Below 12 months; the best hit 5-7 (Stripe) |
Sources: Benchmarkit 2025 SaaS Performance Metrics Report; Optifai benchmark of 939 B2B SaaS companies (Q2 2025-Q1 2026); Bessemer; Stripe.
Read it against your own segment. A 16-month payback is a problem for an SMB product and perfectly healthy for an enterprise one. The cross-segment median of 18 months hides a 15-month spread.
One counterintuitive note from the Benchmarkit data: enterprise deals above $100K ACV recover CAC slower but can be more profitable long-term, because they carry a lower new CAC ratio. Slow payback is not automatically bad economics. It is a cash-timing cost you have to be funded to carry.
Benchmarks by funding stage
Investors apply payback ceilings by stage, and they tighten the earlier you are:
| Stage | Expected CAC payback |
|---|---|
| Seed / Series A | Below 12 months |
| Series B / Growth | Below 18 months |
| Late-stage / Public | Below 24 months |
Source: Optifai. If you are raising a Series A, payback under 12 months for your segment is table stakes. Bessemer publishes segment ceilings of 12, 18, and 24 months for SMB, mid-market, and enterprise.
Why payback stretched from 14 to 18 months
Median payback has lengthened by roughly a third over the past few years, from about 14 to 18 months in the latest Benchmarkit data. Acquisition got more expensive, growth slowed, and the same CAC now buys less recurring revenue.
That trend is the backdrop to every payback conversation in 2026. The median moved against you, so holding steady is itself an improvement. For the full picture, see the 2026 state of SaaS metrics and our benchmarks page.
Why payback matters more than LTV:CAC
The LTV:CAC ratio ignores time, and time is what kills cash-constrained companies. A textbook-healthy 3:1 ratio can still bankrupt you if the lifetime value arrives too slowly to fund the next batch of customers.
Walk the trade-off. Company A has a 2.5:1 LTV:CAC and a 4-month payback. Company B has a stronger 3:1 ratio but an 18-month payback.
On a ratio scorecard, B wins. In real life, A is far safer.
Company A recovers each customer’s cost in a third of a year and recycles that cash into the next cohort almost immediately. Company B fronts cash for a year and a half on every customer, so to grow fast it has to raise more, dilute more, or burn down runway. The 3:1 ratio is real, but it pays out on a timeline that can outlast the bank account.
That is the case for treating payback as your primary acquisition-efficiency metric and LTV:CAC as the supporting one. The ratio tells you whether the math eventually works. Payback tells you whether you survive long enough to find out.
Run both. The LTV:CAC calculator and the deeper LTV:CAC explainer cover the ratio side.
How to reduce CAC payback: four levers, ranked
To shorten payback you either grow the contribution margin in the denominator or shrink the CAC in the numerator. Four levers do it, ranked by speed and certainty of impact.
Lever 1: Price
Raising new-logo prices is the fastest way to cut payback, because it lifts the denominator with zero change to CAC. A price increase flows almost entirely to contribution margin.
Take the earlier example: $12,000 CAC, $1,000 ARPU, 80 percent margin, 15-month payback. Raise new-logo pricing 12.5 percent to $1,125 and contribution margin per month rises to $900.
$12,000 / $900 = 13.3 months. Nearly two months off payback from one pricing decision, no extra spend.
Test it on new logos first so you avoid base churn risk, and model the change with the price increase calculator. More on structuring it in our SaaS pricing guide.
Lever 2: Onboarding speed
Faster time to value shortens payback two ways: it pulls early revenue forward, and it cuts the early churn that resets your payback clock to never. A customer who quits in month three never repaid a cent of CAC, so that acquisition spend is pure loss.
The first 30 to 90 days decide most of this. Get customers to their first real outcome fast and more of them survive long enough to pay you back.
Tightening activation is one of the highest-leverage moves for early-stage SaaS, since it improves payback and churn at once. See our customer onboarding playbook.
Lever 3: Expansion revenue
Expansion revenue shortens payback because the fully loaded formula credits it directly. The expansion-adjusted version reads:
CAC payback = CAC / ((new MRR + net expansion MRR) times gross margin %)
Back to the example. Add $200 of monthly expansion to the original $1,000 ARPU and the denominator becomes ($1,200 times 0.80) = $960. Payback drops to 12.5 months, from 15.
Upsells, added seats, and usage-based billing all feed this. Strong expansion is also what drives net revenue retention past 100 percent, which is the same engine viewed from a different angle.
Lever 4: Lower CAC
Cutting CAC works, but it is the slowest and riskiest lever because pulling spend can throttle growth. Treat it as pruning, not slashing.
Audit channels by their individual payback. Pause campaigns whose payback runs past your segment target, reallocate to the channels that pay back fastest, and trim tooling and agency spend that is not earning its cost.
Channel-level payback is the discipline here. A blended CAC that looks fine can hide one channel quietly dragging the average past 24 months.
Common mistakes
Four errors recur, and each one makes payback look better than it is:
- Ignoring gross margin. The single most common mistake. At 80 percent margin it overstates efficiency by 20 percent; at lower margins, more.
- Applying a blanket 12-month rule. Twelve months is right for SMB and wrong for enterprise. Benchmark against your ACV band.
- Using blended CAC or blended payback. Mixing in expansion from existing accounts understates the true cost of new growth.
- Excluding fully loaded costs. Leave out salaries, commissions, or tooling and your CAC, and therefore your payback, is fiction.
How Mowt tracks CAC payback automatically
Most analytics tools show you a single blended CAC payback number, if they show payback at all. That is the number that hides problems.
Mowt connects to Stripe and computes payback gross-margin-adjusted and broken out by cohort and ACV band, in real time. You see payback move as you ship the price change, tighten onboarding, or kill a channel, and you see which segment is actually carrying the average.
It is the segmented, margin-adjusted view that Baremetrics, ChartMogul, and ProfitWell do not surface out of the box. Founders and finance teams use it to answer the benchmark question with one click instead of a spreadsheet rebuild. See how it compares as a Baremetrics alternative or ChartMogul alternative.
FAQ
What is a good CAC payback period?
A good CAC payback period is under 12 months, and top operators hit 5-7. The right target depends on deal size: under 12 months for SMB, under 18 for mid-market, under 24 for enterprise. The 2026 cross-segment median is about 18 months, so anything meaningfully below that for your band is strong, while above 24 signals a structural cash-flow problem.
How do you calculate CAC payback?
Divide fully loaded CAC (total S&M spend divided by new customers) by monthly revenue per account times gross margin percent. For example, $12,000 CAC divided by ($1,000 ARPU times 80 percent = $800) equals a 15-month payback. Always include the gross-margin step, or you overstate efficiency.
How do you reduce CAC payback?
Pull four levers in order. Raise new-logo prices (fastest, proportional gain), speed up onboarding so customers reach value before they churn, drive expansion revenue through upsells and usage-based pricing, then lower CAC by pausing channels whose payback runs past your target.
Why does CAC payback matter more than LTV:CAC?
LTV:CAC ignores time. You pay acquisition cost upfront but earn lifetime value over years, so a healthy 3:1 ratio can still drain your cash if the money arrives too slowly. Payback measures that exact timing gap, which is why a 2.5:1 ratio with a 4-month payback is often safer than a 3:1 with an 18-month payback.
Should CAC payback use gross margin or just revenue?
Always use gross margin. The dollars available to repay CAC each month are your contribution margin (revenue minus cost of goods sold like hosting, support, and payment fees), not gross revenue. At 80 percent margin, using raw revenue makes payback look about 20 percent faster than it is.
What is the difference between CAC payback and the LTV:CAC ratio?
CAC payback is a months figure that measures how long until a customer repays acquisition cost; LTV:CAC is a unitless ratio of total lifetime value to that cost. Payback governs cash flow and timing; the ratio governs whether the deal is profitable at all. See the CAC payback glossary entry and the LTV:CAC ratio guide for the full breakdown.
About the Author

Matt Smith
Serial entrepreneur and former big 4 consultant turned SaaS operator. Built and scaled analytics and data warehouses platforms at multiple enterprise Stripe companies before founding Mowt. Passionate about making complex metrics accessible to every founder.